


 +1 617 404 2125


Thailand Tourism Statistics 2026-27: Arrivals & Trends


BY David Mickelson
3 days ago


How many people visit Thailand, where do they come from, and what do the latest figures show? This guide brings together the latest reported international-arrival data, source markets, historical comparisons and hotel indicators. Figures are dated so partial-year totals are not mistaken for full-year results.
Thailand Tourism Statistics 2026-27: Latest Arrivals and Markets
Latest available snapshot (checked 17 October 2026): Thailand recorded 23.2 million international arrivals between 1 January and 30 September 2026, down 3.8% from the same period in 2025. Reported international tourism revenue for the period was THB 1,142.485 billion, down 2.26% year over year. These are provisional nine-month figures, not a 2026 full-year result. The Ministry of Tourism and Sports is the origin of the data reported by The Nation Thailand on 14 October 2026; consult the Ministry’s official tourism statistics portal for releases and datasets.
For annual context, the National Statistical Office records 35,545,714 international arrivals in 2024; the Bank of Thailand reports approximately 33.0 million in 2025. Read those as full calendar-year totals and the 2026 figure as year to date. If you are planning a trip, start with our Thailand visitor guide or browse tours across Thailand.
| Reporting period | International arrivals | What the figure means |
|---|---|---|
| 2024 full year | 35,545,714 | Final annual total |
| 2025 full year | About 33.0 million | Annual total, rounded in BOT reporting |
| 1 Jan–30 Sep 2026 | 23.2 million | −3.8% year over year; provisional |
Leading source markets, January–September 2026
China was the largest reported source market in the first nine months of 2026. The table gives the ten leading markets and each market’s change against the same period in 2025.
| Rank | Source market | Arrivals | Change year over year |
|---|---|---|---|
| 1 | China | 3,935,434 | +15.16% |
| 2 | Malaysia | 2,950,327 | −15.19% |
| 3 | India | 1,727,437 | −2.46% |
| 4 | Russia | 1,270,703 | −0.13% |
| 5 | South Korea | 848,647 | −25.43% |
| 6 | Taiwan | 797,056 | +7.86% |
| 7 | Japan | 769,970 | −4.20% |
| 8 | United States | 754,840 | +1.10% |
| 9 | United Kingdom | 730,987 | −3.56% |
| 10 | Germany | 640,674 | −2.47% |
These national totals do not indicate which province each traveler visited. For a Bangkok stay, explore Bangkok tours, our neighbourhood guide, where to shop, and this four-day Bangkok itinerary.
How to read the 2026 figures
Compare the January–September 2026 count with January–September 2025, not with a full year. Arrivals count recorded international entries; they are not necessarily unique people and should not be combined with domestic trips, hotel nights, visitor spending or GDP contribution. Revenue and arrivals are separate indicators and may use different methods or revision schedules. Monthly estimates can be revised when the official series is updated.
Tourism is spread across very different destinations. See practical trip options in Phuket, Chiang Mai, Krabi, and Koh Samui.
Key Thailand Tourism Statistics - 2026 Data
This section keeps the outlook published for 2025 as historical context. It contains targets and third-party market forecasts, not actual 2026 results. The 36–39 million international-visitor range was a 2025 target announced by the Tourism Authority of Thailand in December 2024; it should not be read as the number who visited. The 2025 annual arrival result was about 33.0 million.
- 2025 arrival target at the time: 36–39 million international visitors, a target that was not achieved.
- Commercial market forecasts: The dollar revenue, hotel-user, penetration, average-revenue-per-user and online-sales estimates below came from Statista’s forecast model. They are modeled market estimates, not official government accounts or confirmed outturns. Their scope and definitions may differ from national tourism-revenue statistics.
- Historical 2025 revenue outlook: The THB 1.98–2.23 trillion range was a projection, not a verified 2025 result.
- Campaign context: 2025 was promoted as the “Amazing Thailand Grand Tourism and Sports Year”; this was a campaign designation, not a statistical measure.
- Statista’s 2025 travel-and-tourism revenue forecast was $3,784 million, rising to a projected $4,663 million by 2029 at a forecast annual growth rate of 5.36%.
- Its hotel-market forecast was $1,534 million for 2025; it projected 13.79 million users by 2029, penetration of 25.0% in 2025 rising to 31.4% in 2029, and average revenue per user of $210.60.
- The model projected online sales to account for 76% by 2029. This describes the forecast’s modeled sales channel, not a measured share of all Thai tourism spending.
- The forecast also compared the United States’ projected 2025 tourism revenue at $224 billion; this is a model estimate and is not directly comparable with Thailand’s national accounts.
These forecast values are retained to document what was previously expected. They should not be used as current results or as a like-for-like comparison with official Thai statistics.
Thailand Tourism Statistics in 2024
The final annual count is 35,545,714 international arrivals, compared with 28,150,016 in 2023—an increase of about 26.3%. The final count is higher than the preliminary “over 35 million” announcement made at the end of 2024. The National Statistical Office’s 2025 Statistical Yearbook is the source for the final annual series.
- International arrivals: 35,545,714 for calendar 2024 (final annual series).
- Growth: about 26.3% compared with 2023’s 28,150,016 arrivals.
- Revenue: The Tourism Authority of Thailand’s 28 December 2024 announcement described tourism revenue as exceeding THB 1.8 trillion. Treat this as the contemporaneous preliminary announcement; revenue estimates can vary by definition and later revision.
- Hotel occupancy: The NSO yearbook reports a 71.50% annual average for 2024. This annual hotel indicator is not the same measure as a year-to-date occupancy snapshot.
For its end-of-year announcement, see the Tourism Authority of Thailand release. For planning ideas alongside the figures, visit our Thailand things-to-do guide.
Key Drivers of Thailand Tourism Growth in 2024
The following points describe the policy and travel environment in 2024; they are historical context, not a description of current entry rules. Check official rules before travelling, because visa policies change.
Visa and immigration reforms in 2024:
- Thailand introduced visa-free stays of up to 60 days for eligible travelers from 93 countries and territories in July 2024. The eligible list and permitted stay have since changed; do not rely on this historical rule for a current trip.
- Temporary suspension of TM.6 arrival/departure forms at designated checkpoints was another administrative measure reported at the time.
Aviation capacity: Contemporary 2024 reports cited expanded airline capacity, extra seasonal flights and additional routes. Capacity is not the same as completed passenger arrivals, and seasonal schedules vary.
Events and festivals: Songkran celebrations, year-end countdown events and international media exposure supported destination visibility. Their individual effect on arrivals is not isolated by the annual arrival total.
Sustainability: Responsible tourism and lower-impact experiences featured increasingly in destination planning. This is a broad industry trend rather than a quantified explanation for the 2024 arrival increase.
Thailand Tourism Statistics by Country
The table below is the article’s retained historical comparison for January–June 2024 versus January–June 2023. It is not the latest ranking; use the January–September 2026 table above for the current source-market snapshot. The historical figures were attributed to Thailand’s tourism authorities.
Nationality | 2024 YTD (Jan-Jun) | 2023 YTD (Jan-Jun) | % Change |
|---|---|---|---|
China | 3,439,482 | 1,443,119 | 138.34% |
Malaysia | 2,435,960 | 2,139,854 | 13.84% |
India | 1,040,069 | 761,463 | 36.59% |
Korea (Republic of) | 934,983 | 763,079 | 22.53% |
Russian Federation | 920,989 | 791,574 | 16.35% |
Laos | 618,792 | 423,257 | 46.20% |
Taiwan | 533,280 | 317,890 | 67.76% |
The United States of America | 507,251 | 458,337 | 10.67% |
Vietnam | 501,895 | 509,743 | -1.54% |
United Kingdom | 485,093 | 403,056 | 20.35% |
Thailand Tourism Statistics by Month
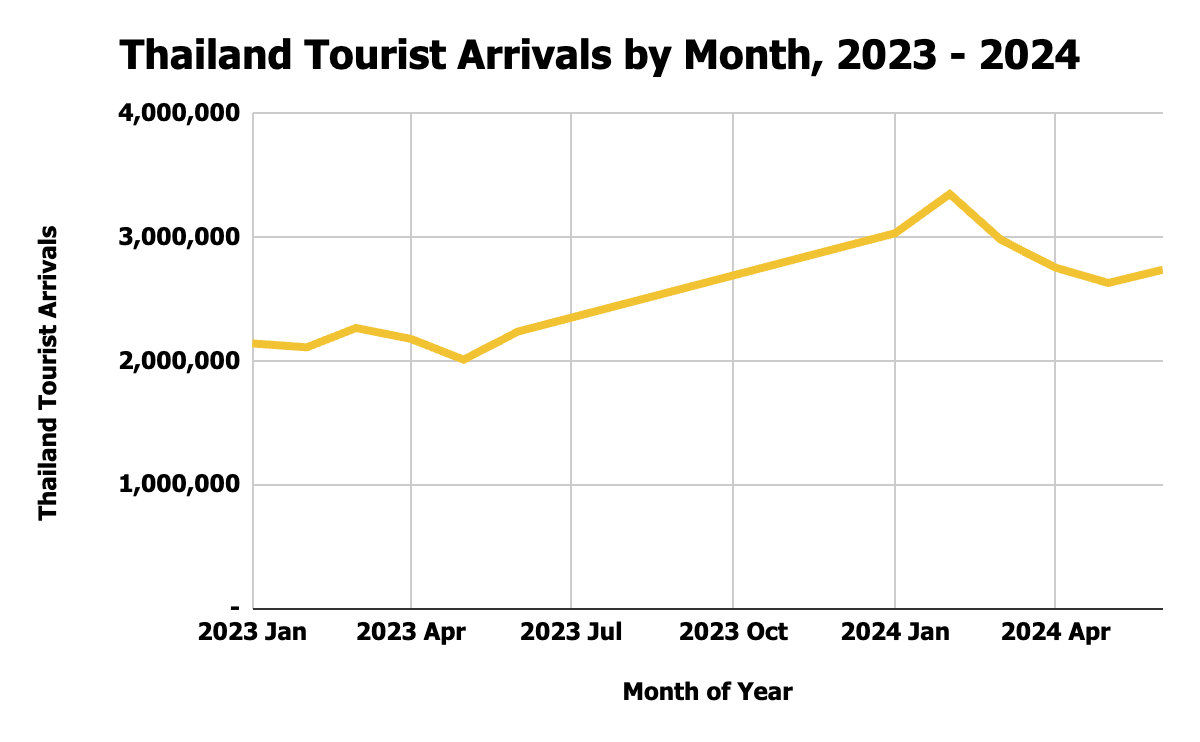
This retained table shows the original January–June comparison for 2023 and 2024. The numbers are a historical snapshot, not a complete annual series or current monthly data. For a more recent monthly indicator, the Bank of Thailand’s tourism dashboard currently reports arrivals through August 2026.
Month of Year | Thailand Tourist Arrivals |
|---|---|
2023 Jan | 2,144,948 |
2023 Feb | 2,113,550 |
2023 Mar | 2,269,733 |
2023 Apr | 2,182,100 |
2023 May | 2,013,852 |
2023 Jun | 2,241,201 |
2024 Jan | 3,035,296 |
2024 Feb | 3,352,302 |
2024 Mar | 2,982,721 |
2024 Apr | 2,757,128 |
2024 May | 2,633,464 |
2024 Jun | 2,740,372 |
The Bank of Thailand series lists 2.515 million arrivals in August 2026, 2.546 million in July, 1.842 million in June, 2.347 million in May, 2.369 million in April and 2.775 million in March. The Ministry’s nine-month total above uses its own reported series and may differ in timing, revisions or statistical definition. See the Bank of Thailand monthly tourism indicators for the underlying series.
Thailand Tourist Arrivals - Trends and Analysis
Historical context retained from the original analysis: arrivals rose from about 29.9 million in 2015 to 39.8 million in 2019. They then fell sharply during the COVID-19 border restrictions, to roughly 6.7 million in 2020 and very low levels in 2021, before recovering to about 11 million in 2022. These are rounded historical figures from the earlier article; the official annual figures cited in this update should be preferred where available.
Thailand’s recovery after pandemic travel restrictions was rapid, but annual totals do not rise every year. The official NSO annual series records 28.15 million arrivals in 2023 and 35.55 million in 2024. The Bank of Thailand reports roughly 33.0 million in 2025. The 2026 figure cited here covers only January through September, so it must not be compared directly with a full-year number.
For a valid year-over-year comparison, use matching months and the same source series. Changes in air access, visa rules, traveler confidence, exchange rates, regional competition and disruptions can all affect demand; the arrival counts alone do not prove the cause of a change.
Thailand Tourism Stats by Province
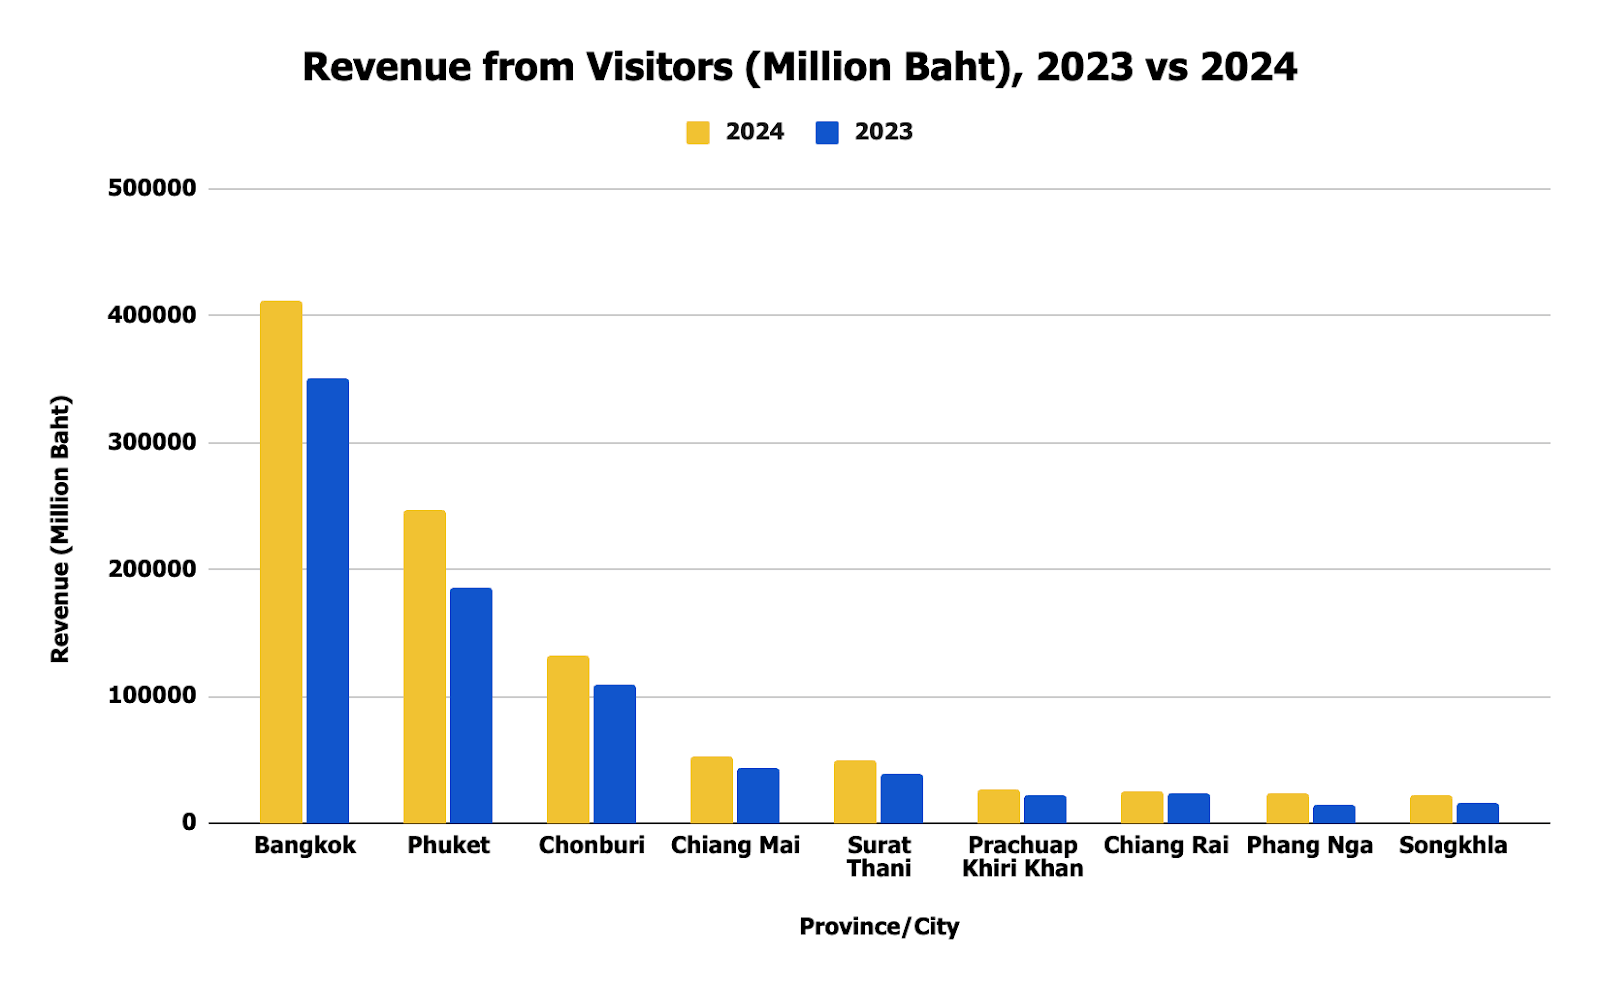
The chart and province figures in this section are the article’s earlier snapshot, covering 2023 and January–June 2024. Keep them as historical context rather than a current provincial ranking. National arrivals are not automatically allocated to provinces, and a traveler may visit several destinations on one trip. For current trip planning, compare what each region offers: Phuket tours, Chiang Mai experiences, and Krabi day trips.
Thailand Occupancy Rates
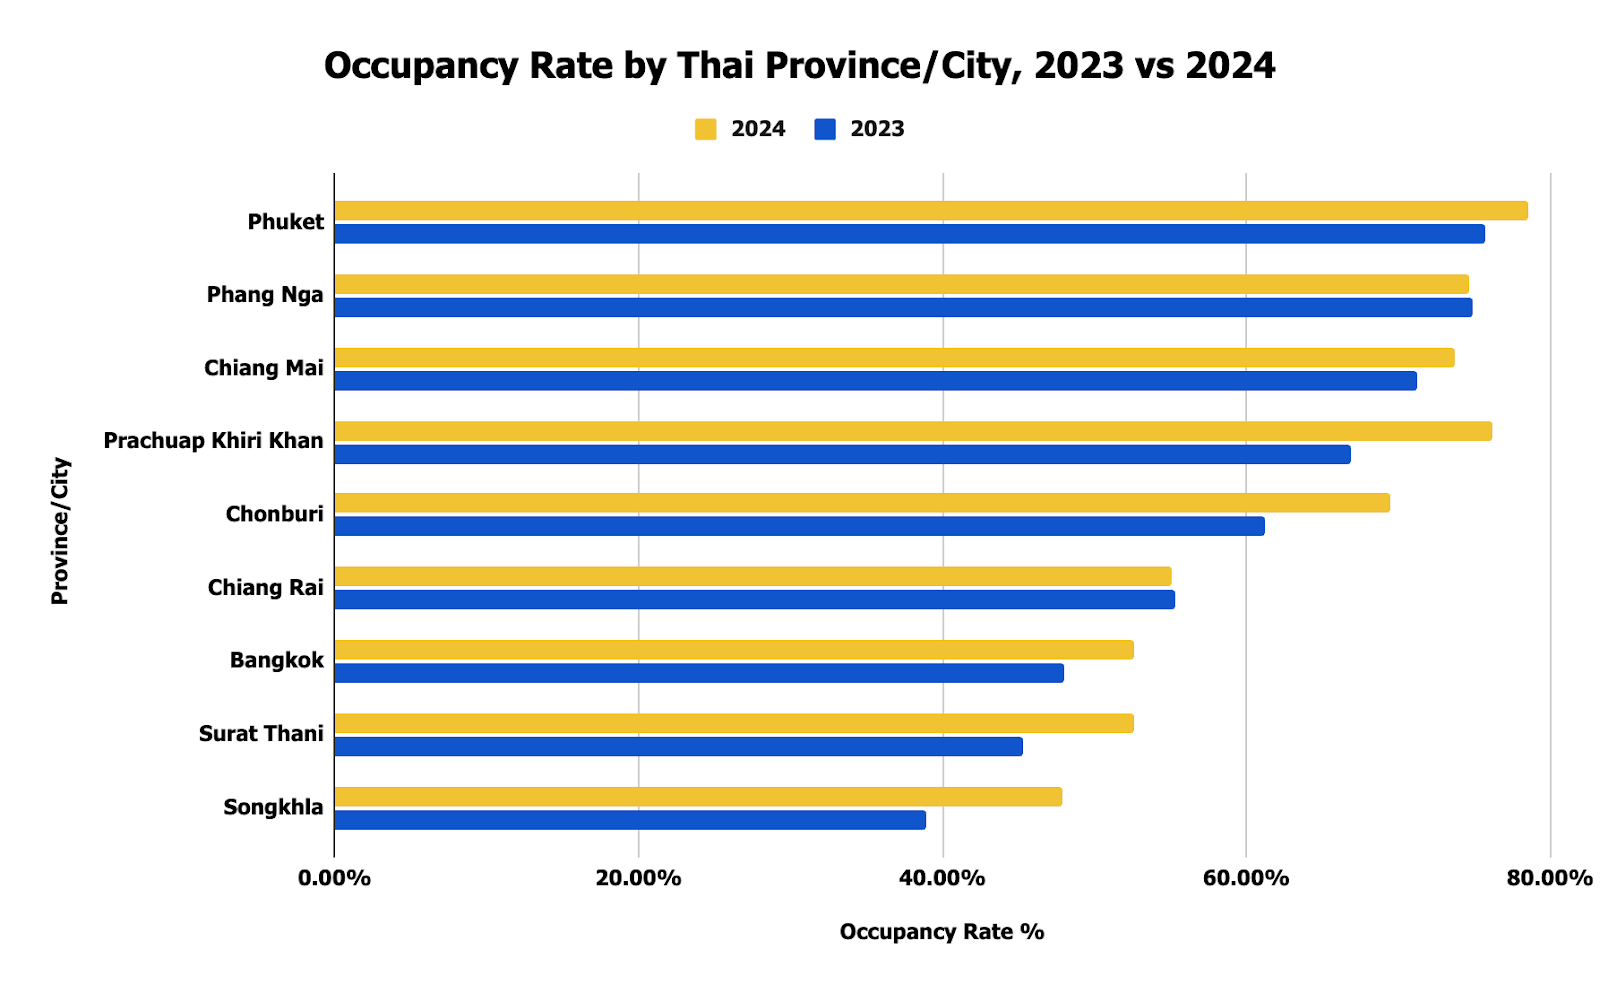
The original city and province occupancy figures below this image describe January–June 2023 and preliminary January–June 2024 conditions. The retained values were Bangkok 47.99% to 52.66%, Phuket 75.77% to 78.54%, and Chiang Mai 71.25% to 73.70%. The original analysis also reported Nakhon Phanom rising from 49.50% to 61.98%, Ranong from 42.99% to 55.29%, and Ayutthaya from 52.40% to 64.02%. They are retained as historical reference; occupancy changes by season, property type and survey coverage.
| Region, August 2026 | Hotel occupancy rate |
|---|---|
| Thailand overall | 68.50% |
| Central region (including Bangkok) | 70.77% |
| South | 70.30% |
| Northeast | 64.54% |
| North | 60.25% |
These are the Bank of Thailand’s August 2026 regional occupancy indicators; they are not directly interchangeable with the NSO’s 71.50% 2024 annual average. The same dashboard lists an average room rate of THB 1,788.25 for August 2026. See the monthly indicators and their reporting periods.
Thailand’s Position as a Global Tourism Hub
Thailand combines major cities, island and coastal destinations, cultural sites, food, nature and a broad range of accommodation. The statistics show both the scale of international demand and the need to look beyond one headline number: source markets shift, monthly arrivals fluctuate, and visitor spending or hotel occupancy measures a different part of tourism activity.
Looking Ahead: 2026–27 Tourism Outlook
As of October 2026, the Tourism Authority of Thailand’s stated aim was to keep full-year international arrivals around 33 million, approximately matching the 2025 total. This is an agency target, not a confirmed outcome. No 2027 numerical target is asserted here without a published, directly verifiable source. For 2027, watch the Ministry’s final annual count, arrivals by source market, air capacity, hotel occupancy and tourism receipts as those releases become available.
For travelers, the national trend is only a starting point: choose destinations, season and pace to fit your interests. Our Thailand visitor guide and Thailand tours can help turn the data into a practical itinerary.
Sources and data notes
- National Statistical Office of Thailand, Statistical Yearbook 2025: international arrivals (final 2024 total and 2023 comparison).
- National Statistical Office of Thailand, Statistical Yearbook 2025: domestic tourism and accommodation tables.
- Bank of Thailand, Annual Report 2025 (annual tourism context).
- Bank of Thailand, Tourism Indicators (monthly arrivals, hotel occupancy and room rates; series updated 14 October 2026).
- Ministry of Tourism and Sports, tourism statistics portal (official statistical releases and data archive).
- The Nation Thailand, 14 October 2026 (reporting Ministry figures for January–September 2026 and the TAT’s 2026 aim).
- Tourism Authority of Thailand, 28 December 2024 (preliminary 2024 announcement and 2025 target).
Last reviewed: 17 October 2026. Historical tables and chart images are retained; later official revisions may change provisional figures.
Recommended Articles




Get your VACATION on!
Expertly curated emails packed full of vacation inspiration, travel tips and more!